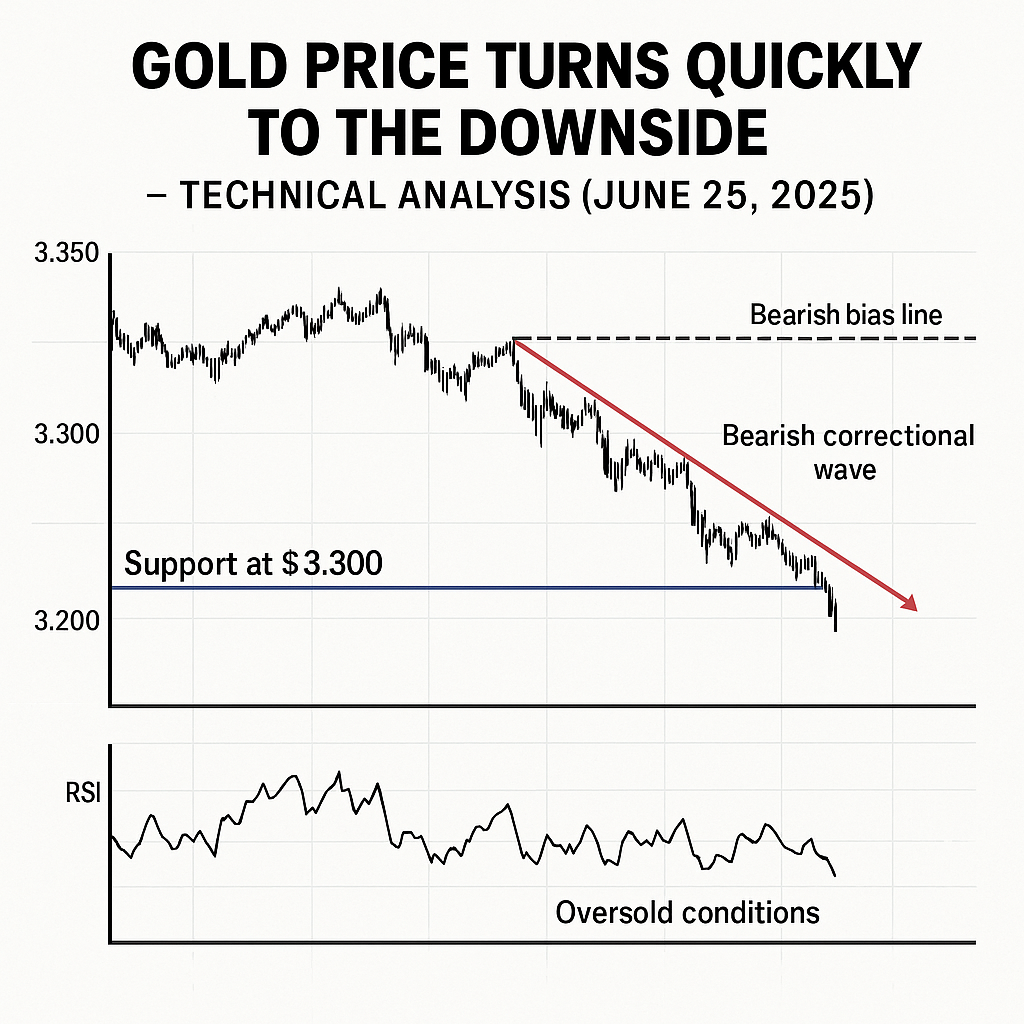
Gold Price Turns Quickly to the Downside – Technical Analysis (June 25, 2025)
The gold price forecast XAUUSD today reveals a sudden bearish reversal after an early bounce. As of June 25, 2025, gold has dropped back under pressure, failing to sustain gains above resistance. All eyes are now on the $3,300 support level as sellers re-enter the market. This forecast breaks down the key levels, chart patterns, and RSI conditions that matter right now.
📉 Key Technical Highlights
- Support at $3,300 held the line: Gold bounced off the $3,300 level yesterday, triggering short-term bullish momentum
- Oversold conditions evident: The Relative Strength Index (RSI) entered oversold territory, signaling a relief bounce
- Inbound bearish pressure: Despite the short-lived rally, gold remains within a bearish correctional wave, maintaining a downward trajectory on short-term charts
- Resistance levels remain formidable: The current rebound is likely capped by a bearish bias line unless strong upside resistance is overcome
⚙️ What This Means for Traders
| Market Condition | Description | Implication |
|---|---|---|
| Short-term bounce | Relief rally from an oversold RSI and near $3,300 support | Ideal for scalpers and counter-trend traders |
| Bearish correction | Dominant structure remains downward-sloping | Medium-term traders should stay cautious |
| Critical resistance | Need a break above bearish bias line to shift sentiment | Breakout required for bullish continuation |
- The short-term rebound may offer tight, low-risk entries on long positions around $3,300–$3,320 with stops just below this zone.
- For trend-followers, the bearish correction suggests prioritizing sell-on-rally setups until the downtrend is decisively broken.
🔍 Summary Outlook
Gold remains in a technical tug-of-war: while short-term indicators hint at a bounce from oversold conditions, the broader structure continues to trend downward. Traders should:
- Use disciplined position sizing and define clear stop-loss levels near technical support.
- Watch for a break above the bearish bias line—a key signal for a potential reversal.
- In the absence of such confirmation, expect the correction to persist, with possible further downside.
✅ What to Watch Next
- RSI Movement: Is it stabilising or reversing lower?
- Price vs. bias line: Will gold fail or break through?
- Momentum & volume: Are aggressive sellers still present on rallies?
Analysis based solely on technical indicators without macroeconomic commentary. Consult multiple sources before making trading decisions.